Origin of the Organization Chart as a Tool of Business Management
Joe Kolinger, Founder and CTO of OfficeWork Software, explores how through necessity the first organizational charts came to be and how they shaped business management today.
Organizational charts today have a mixed reputation. While companies need them they are typically difficult to create and maintain. Have you stopped to wonder what they are really good for?
Looking at most organization charts today you’ll notice a top-down hierarchy of an organization’s members and their roles. They display a linear flow of higher level management to the lower level worker bees. According to OfficeWork Software’s research of over ten thousand companies this top-down linear, hierarchical flow is how 95% of companies want to display their org charts. The remaining 5% want some kind of matrix representation. Also of note is that 50% of companies use org charts as a reference to view areas of assignment responsibility and paths of communication. The remaining 50% use them for some kind of workforce planning and organization design to improve business performance.
The history of the organization chart is interesting as it gives us insight on its original purpose and challenges us to think differently about how we visualize and manage the workforce for business success.
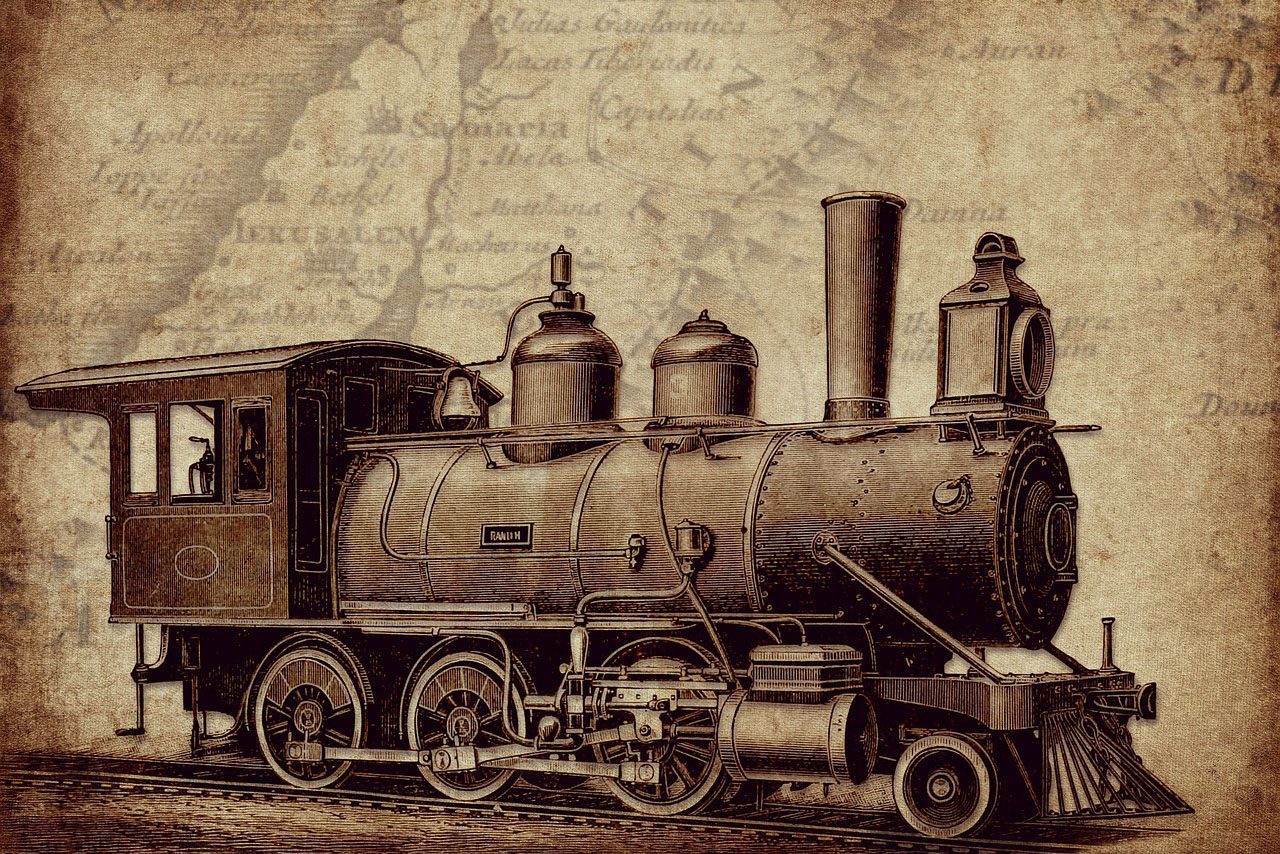
In the 1800s the industrial revolution was in full swing, with railroad tracks being laid across the country, tying urban industrial centers together. At that time building organizations was a new thing as the country transitioned from an agrarian to a manufacturing economy.
The origin of the organization chart dates back to the mid-1800s, at a time of expanding railroad businesses. Notably, the Erie Railroad was a thriving but extremely disorganized company responsible for transporting goods throughout the Northeastern United States. At this time most railroad companies covered short distances. But the Erie Railroad company had more than 500 miles of track, which was one of the largest of its time. The Erie Railroad business continued to expand but chronic disorganization was seriously impeding its performance.


A Civil War veteran, and management ‘hardball’ guy, Brigadier General Daniel McCallum is recognized as the developer of the org chart. McCallum had an interesting career. Before serving as a general in the Union Army during the Civil War (1860-1865), he was an architect. In the 1840s he served as principal architect in Rochester New York, holding a high position in the profession. He worked on a number of high-profile buildings such as the House of Refuge, St. Joseph’s Church, and St. Mary’s Hospital. He did a lot to improve the general architecture of Rochester. Of note were his drawings and studies, which were carefully made. He had a reputation as a solid architect and a good manager.
Perhaps a bit of a tangent, but useful in understanding his background, McCallum developed a special type of covered, truss bridge, capable of handling heavy railroad track and trains. His design was patented and some of the bridges, applauded for excellent design and durable construction are still in use today.

New York & Erie Railroad system map, circa 1855. Images: Wikipedia
McCallum was originally employed at the New York & Erie Railroad as subcontractor to build and maintain bridges. He was appointed superintendent of one region and was eventually promoted to General Superintendent in 1855, controlling over 5,000 employees. In this new position McCallum was introduced to large-scale management problems, which other great railroad companies were also encountering at that time. One of the main problems of these large railroad companies was the rising of costs of moving freight in comparison to smaller companies. McCallum postulated that this was caused by an inefficient internal organization. In his 1856 report to the New York & Erie Railroad stockholders he explained:
“A superintendent of a road only fifty miles in length can give the business his personal, professional attention and may be constantly on the line engaged in the direction of its details. He knows everyone, and all questions in relation to its operation are easily presented and acted upon. But, in governing five hundred miles of track, a very different challenge exists. I am fully convinced that a larger scale railroad and system demands more rigor and perfection in the operations management discipline.”
So with these larger railroads, the more casual, ad hoc management (amenable to smaller railroads) was proving grossly insufficient for controlling larger railroad systems. Hence new methods had to be invented for mobilizing, controlling, and apportioning capital, for operating a more widely dispersed system, and for supervising thousands of specialized workmen spread over hundreds of miles. Ultimately, the larger railroads at this time solved all these efficiency problems and became the model for all large businesses. The main innovators of these new management methods were three engineers, Benjamin H. Latrobe of the Baltimore and Ohio, McCallum of the Erie, and John Edgar Thomson of the Pennsylvania. So what did they do? They first devised the functional departments and then defined the lines of authority, responsibility, and communication along with the accompanying separation of line and staff duties which became the principles of the modern U.S. corporation.
McCallum’s principles and procedures of management, like his organization chart, were new in American business. No earlier American businessman had ever had the need to develop ways to use internally generated data as instruments of management. None had shown a comparable concern for the theory and principles of organization.
McCallum developed six general principles to creating an efficient system of operations:
- First. A proper division of responsibilities.
- Second. Sufficient power conferred to enable the same to be fully carried out, that such responsibilities may be real in their character.
- Third. The means of knowing whether such responsibilities are faithfully executed.
- Fourth. Great promptness in the report of all derelictions of duty, that evils may at once be corrected.
- Fifth. Such information to be obtained through a system of daily reports and checks that will not embarrass principal officers nor lessen their influence with their subordinates.
- Sixth. The adoption of a system, as a whole, which will not only enable the general superintendent to detect errors immediately, but will also point out the delinquent.
He also proposed a core principle of management:
“All that is required to render the efforts of railroad companies in every respect equal to that of individuals, is a rigid system of personal accountability through every grade of service. That, my friends, is the impetus behind the org chart: a rigid system of personal accountability throughout every grade of the organization.”
So with a larger scale of business new management concepts, data and tools became both essential and the norm.
What did the first organization chart look like? McCallum started with a clear concept of organization (Figure 1.) and then broke it into a hierarchical outline as seen in Figure 2.


Figure 1. Principal Officers Functions. Image: Wikipedia Figure 2. A Hierarchy of Functions. Image: Wikipedia
Based on these prerequisites, here is the organization chart McCallum developed. This was his Organization Scheme (first divisions, then subordination)

Image: McKinsey & Company
Instead of the top-down structure we’re most familiar with, the chart flows upwards like the branches of a tree. The president and board of directors, and the power of the organization, is centralized at the core. Much of the day-to-day responsibility was distributed to the lower-level staff (superintendents). The theory was that those closest to the tracks were in the best position to make operational decisions and quash any operational inefficiencies.
The detail of the graphic here is perhaps difficult to read, but this org chart diagram was a management tool that was instrumental in helping McCallum and his management operate the Erie Railroad both effectively and efficiently.
The internal data that was used in the development of this chart was very helpful in delegating tasks to the right person and obtaining critical information to run the business.
Today, we deal with inconceivably large amounts of data that is made comprehensible only by modern technology. Back in the 19th century, big data meant something entirely different, but managing it was as vital then as it is today.
We’ve learned how the org chart came into existence and its usefulness as a management tool. Most businesses today use org charts, but not all use them in the same fashion. McCallum’s org chart was a work of art and took much time to create, which was probably tolerable considering the slower pace of business change in the 1880s. Today the demands placed on business require far faster responses to change. Tools that enable quick reorganization or redeployment of personnel give a competitive advantage to those that use them.
OfficeWork Software serves its clients with technologies to enable business and workforce excellence. Our OrgChart brand of technologies are proven solutions that will help your company succeed.
Please visit us at orgchartpro.com
References
- Wikipedia. Organizational Chart.
- Stinson, Liz (2014) The First Org Chart Ever Made Is a Masterpiece of Data Design in Wired.
- Caitlin Rosenthal (2012) “Big data in the age of the telegraph” in McKinsey Quarterly, March 2013.
- Wikipedia. Daniel McCallum.

